Reducing stable Rust memory footprint by using the system malloc
2018-02-16 12:29:05 +0000
Reducing stable Rust memory footprint by using the system malloc
Preface
I started writing a small network latency measurement tool that is designed to run
on Kubernetes as a DaemonSet, exporting metrics to Prometheus.
I called it KubeCanary (because it reminds me of something from a previous job :D).
Essentially it's about all nodes in the cluster pinging each other and measuring
the latency and the packet loss.
Being something that runs on all nodes in the cluster I was understandably
concerned with resource utilization, but I thought that because it's very simple and
small (so far), and is written in Rust after all, so it should be fairly efficient...
The Surprise
To my surprise, after deploying I noticed a huge discrepancy in the memory utilization across the nodes :
%> mpssh f k8s.txt 'echo $(($(ps -C kube-canary --no-headers -orss) / 1024)) MB'
MPSSH - Mass Parallel Ssh Ver.1.4-dev
(c)2005-2013 Nikolay Denev <ndenev@gmail.com>

  [*] read (9) hosts from the list
  [*] executing "echo $(($(ps -C kube-canary --no-headers -orss) / 1024)) MB" as user "nikolay"
  [*] spawning 9 parallel ssh sessions

 k8s-worker1.stg -> 37 MB
 k8s-worker2.stg -> 55 MB
 k8s-worker3.stg -> 58 MB
 k8s-worker4.stg -> 84 MB
 k8s-worker5.stg -> 47 MB
 k8s-worker6.stg -> 17 MB
 k8s-master1.stg ->  9 MB
 k8s-master2.stg -> 10 MB
 k8s-master3.stg ->  8 MB

  Done. 9 hosts processed.
%> _
It seems to be using some excessive amounts of memory on some nodes, while others have pretty low numbers. Was it leaking memory? How could it be, it's in Rust after all? :)
After the first few moments of surprise passed, I noticed how it is the master nodes standing out by
using significantly less memory than the rest, and I decided to check what's different.
For starters, they are virtual machines. But just being virtual machines
is no reason to have different usage, after all, they run the same OS as the workers.
Then I decided to jump to the node with the most used memory, and after a brief check I realized it's not only the node with the most used memory by kube-canary but also the node with the most
physical memory available and, most importantly highest count of CPU cores! Ok now, this might be it:
%> mpssh -sf k8s.txt nproc
MPSSH - Mass Parallel Ssh Ver.1.4-dev
(c)2005-2013 Nikolay Denev <ndenev@gmail.com>

  [*] read (9) hosts from the list
  [*] executing "nproc" as user "nikolay"
  [*] strict host key check disabled
  [*] spawning 9 parallel ssh sessions

 k8s-worker1 -> 32
 k8s-worker2 -> 32
 k8s-worker3 -> 24
 k8s-worker4 -> 40
 k8s-worker5 -> 32
 k8s-worker6 -> 12
 k8s-master1 -> 4
 k8s-master2 -> 4
 k8s-master3 -> 4

  Done. 9 hosts processed.
%> _
Enter jemalloc
Seeing the memory utilization following the number of the cores I remembered that Rust uses the highly performant jemalloc memory allocator, which I still remember when it appeared in FreeBSD for the first time.
Quoting the webpage:
jemalloc is a general purpose malloc(3) implementation that emphasizes fragmentation avoidance and scalable concurrency support. jemalloc first came into use as the FreeBSD libc allocator in 2005, and since then it has found its way into numerous applications that rely on its predictable behavior. In 2010 jemalloc development efforts broadened to include developer support features such as heap profiling and extensive monitoring/tuning hooks. Modern jemalloc releases continue to be integrated back into FreeBSD, and therefore versatility remains critical. Ongoing development efforts trend toward making jemalloc among the best allocators for a broad range of demanding applications, and eliminating/mitigating weaknesses that have practical repercussions for real world applications.
Then I found the following interesting paragraph under IMPLEMENTATION NOTES in the manual page:
_This allocator uses multiple arenas in order to reduce lock contention for threaded programs on multi-processor systems. This works well with regard to threading scalability, but incurs some costs. There is a small fixed per-arena overhead, and additionally, arenas manage memory completely independently of each other, which means a small fixed increase in overall memory fragmentation. These overheads are not generally an issue, given the number of arenas normally used. Note that using substantially more arenas than the default is not likely to improve performance, mainly due to reduced cache performance. However, it may make sense to reduce the number of arenas if an application does not make much use of the allocation functions.
In addition to multiple arenas, this allocator supports thread-specific caching, in order to make it possible to completely avoid synchronization for most allocation requests. Such caching allows very fast allocation in the common case, but it increases memory usage and fragmentation, since a bounded number of objects can remain allocated in each thread cache._
Ok, it's using multiple allocation arenas, there must be a way to set that:
opt.narenas (unsigned) r-
    Maximum number of arenas to use for automatic multiplexing of threads and arenas.
    The default is four times the number of CPUs, or one if there is a single CPU.
A-ha, so jemalloc can cause higher memory utilization depending on the cores.
That's the price for the higher performance and scalability, but I felt that's
too much for my simple case.
So, lets try to set the number of allocation arenas. This is easy, I just need to
set an environment variable in the DaemonSet spec.template.spec.containers's env list:
  {
      "name": "JE_MALLOC_CONF",
      "value": "narenas:1"
  }
Redeploying the DaemonSet I did see memory utilization to drop by about 50%, but it
still seemed a bit high and also was roughly following the number of cores.
So then I spent the next our Googling how to force Rust not to use jemalloc.
*Note: It was later when I actually realized that Shio, the HTTP server I'm embedding, by default spawns number of threads equal to the CPU count.
Rust Allocators
After some Googling, I found out the following post global_allocator
, and the related issue #27389 that is tracking the implementation of this feature. Unfortunately, the issue is still open, and while there is a way to switch the allocator, it is something that's supported only on Rust -nightly, and I wanted to use -stable.
An older version of the Rust Book was talking about this, and had some detail on the available allocators:
Default Allocator
The compiler currently ships two default allocators: alloc_system and alloc_jemalloc (some targets don't have jemalloc, however). These allocators are normal Rust crates and contain an implementation of the routines to allocate and deallocate memory. The standard library is not compiled assuming either one, and the compiler will decide which allocator is in use at compile-time depending on the type of output artifact being produced.
Binaries generated by the compiler will use alloc_jemalloc by default (where available). In this situation the compiler "controls the world" in the sense of it has power over the final link. Primarily this means that the allocator decision can be left up the compiler.
Dynamic and static libraries, however, will use alloc_system by default. Here Rust is typically a 'guest' in another application or another world where it cannot authoritatively decide what allocator is in use. As a result, it resorts back to the standard APIs (e.g. malloc and free) for acquiring and releasing memory.
A-ha! (again), so If I compile my Rust program as a static library it will use the system allocator! Ok, now this is helpful, and it might as well be easy to accomplish.
Tying (linking) the pieces together
So, what I need to do is to have my Rust program compile as a static library, and then have some small piece of C glue to call it.
The first part is easy, I just need to add the library ([lib]) target to Cargo.toml:
[lib]
name = "kube_canary"
crate-type = ["staticlib"]
path = "src/main.rs"
Note: This is not exactly correct, as I'm abusing
main.rsto be both the entry point of a binary and a library. I guess I should have switched the crate type to be a library, but I wanted to have both for comparison during development. So far the only effect I see is thatcargocomplains with:warning: file found to be present in multiple build targets: /Users/nikolay/te/kube-canary/src/main.rs
Then it needs to be exposed so that we can call it from "outside".
#[no_mangle]
pub extern "C" fn kube_canary() {
    main();
}

fn main() {
  ...
}
#[no_mangle] is important, as otherwise, the compiler will mangle(autogenerate some random name) the symbol
and it won't be easily callable from C.
Then the actuall new binary is as simple as that:
#include <stdint.h>
#include <stdio.h>

extern void kube_canary();

void main()
{
    kube_canary();
}
And last but not least, I needed to modify the Dockerfile:
diff --git a/Dockerfile b/Dockerfile
index fb1a94d..d0094fe 100644
--- a/Dockerfile
+++ b/Dockerfile
@@ -9,9 +9,10 @@ RUN sudo apt-get update && \
 ADD . ./build/
 RUN sudo chown -R rust:rust /home/rust

-RUN cd build && cargo build --release && \
-    sudo mv /home/rust/src/build/target/x86_64-unknown-linux-musl/release/kube-canary /kube-canary && \
-    sudo rm -rf /home/rust/src/build
+RUN cd build && cargo build --release --lib && \
+    gcc -o kube-canary main.c target/x86_64-unknown-linux-musl/release/libkube_canary.a -static && \
+    sudo mv kube-canary /kube-canary && \
+    sudo rm -rf /home/rust/src/build

 USER root
 CMD []
Now, lets build and deploy this and see how it goes!
Results
Whoa! Look at that:
%> mpssh -sf k8s.stg.txt 'echo $(($(ps -C kube-canary --no-headers -orss) / 1024)) MB'
MPSSH - Mass Parallel Ssh Ver.1.4-dev
(c)2005-2013 Nikolay Denev <ndenev@gmail.com>

  [*] read (9) hosts from the list
  [*] executing "echo $(($(ps -C kube-canary --no-headers -orss) / 1024)) MB" as user "nikolay"
  [*] strict host key check disabled
  [*] spawning 9 parallel ssh sessions

 k8s-worker1.stg -> 8 MB
 k8s-worker2.stg -> 10 MB
 k8s-worker3.stg -> 6 MB
 k8s-worker4.stg -> 10 MB
 k8s-worker5.stg -> 8 MB
 k8s-worker6.stg -> 6 MB
 k8s-master1.stg -> 6 MB
 k8s-master2.stg -> 5 MB
 k8s-master3.stg -> 6 MB

  Done. 9 hosts processed.
%> _
That is a LOT less memory used compared to where we started! I understand that probably it would perform slightly worse, but I'm not worried about that now, and also I didn't notice significant CPU utilization change.
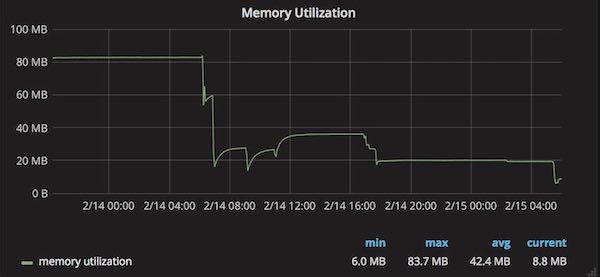
Here is also a graph of the average memory utilization for the kube-canary Pods:

It starts high, around the middle I'm playing with various jemalloc settings like opt.narenas and at the very end, we see the graph drops even further.
Conclusion
It was fun playing with this and learning a thing or two in the process. I'm happy with the significantly reduced memory footprint, and I'm looking forward to seeing the global_allocator API in -stable someday,
so that I don't have to use C (even though it's few lines)
Update 2018-02-18 09:54:05 +0000
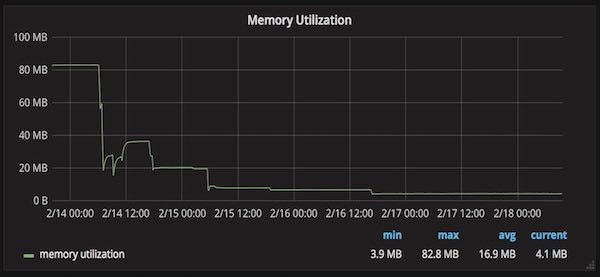
Further using avoiding Clone and using refs in a few places, and most importantly setting the Shio thread count to 4 (just picked 4, which should be sufficient for a prometheus scrape endpoint) instead of the default that is equal to the number of the CPU cores I got even lower memory utilization:

Links:
- My tweet about this.
jemalloc's home page http://jemalloc.net- The Rust programming language home page.